
Beginner's Guide to TradingView: Charting and Analysis for Crypto Newcomers


Welcome to Blockchain Trends, your go-to source for understanding the revolutionary power of blockchain beyond the hype. Ever wondered how to navigate the complex world of crypto charting? This week, we're diving deep into the TradingView crypto charting basics – a vital skill for anyone looking to make informed decisions in the decentralized financial landscape. Ready to unlock the secrets of interpreting crypto charts and take your trading to the next level? Let's get started and see how TradingView can empower you!
- Introduction to TradingView for Crypto Beginners
- Getting Started with TradingView: Setting Up Your Workspace
- Mastering TradingView Crypto Charting Basics
-
Frequently Asked Questions
- What is TradingView and why is it useful for crypto trading?
- How can I set up a basic crypto chart on TradingView?
- What are some essential technical indicators for crypto beginners to use on TradingView?
- How can I use TradingView to identify potential trading opportunities in the crypto market?
- What are some of the free features on TradingView that are most helpful for crypto analysis?
- Final Reflection: Navigating Crypto Waters with Confidence
- Unlock Your Trading Potential: Master TradingView Today!
Introduction to TradingView for Crypto Beginners
TradingView has become an indispensable tool for traders across various markets, and the cryptocurrency space is no exception. For newcomers entering the volatile world of digital assets, understanding how to effectively analyze price movements is crucial. This guide provides a foundational look at using TradingView specifically for crypto, helping beginners navigate its powerful features to make more informed decisions. Mastering TradingView crypto charting basics is a fundamental step for anyone serious about trading cryptocurrencies.
The platform offers a comprehensive suite of charting tools, technical indicators, and social networking features that allow users to not only visualize price data but also share ideas and learn from experienced traders. Unlike basic exchange charts, TradingView provides advanced capabilities essential for in-depth technical analysis, which is vital for understanding market trends and potential price reversals in crypto markets known for their rapid fluctuations.
Why TradingView is Essential for Crypto Charting and Analysis
TradingView stands out as a premier platform for crypto charting and analysis due to its robust features and extensive data feeds. It aggregates data from numerous cryptocurrency exchanges worldwide, offering traders a consolidated view of market prices and volume. This eliminates the need to jump between multiple exchange interfaces just to see different price points or liquidity levels for a specific asset like Bitcoin (BTC) or Ethereum (ETH). The platform's ability to display data from various sources side-by-side is a significant advantage for serious analysis.
Furthermore, the depth of technical indicators available on TradingView is unparalleled for a free or affordable platform. Users can access hundreds of built-in indicators, ranging from simple moving averages (SMA) and relative strength index (RSI) to more complex tools like the Ichimoku Cloud or Fibonacci retracements. For beginners learning TradingView crypto charting basics, having access to these tools is invaluable for identifying potential entry and exit points, understanding market momentum, and developing a trading strategy based on technical analysis rather than pure speculation.
What This Beginner's Guide to TradingView Covers
This beginner's guide is designed to walk you through the fundamental aspects of using TradingView specifically for cryptocurrency trading. We will start with the absolute basics: signing up for an account and understanding the platform's interface layout. This initial step is crucial for ensuring you can comfortably navigate the various menus and panels to access the tools you need for your analysis.
Following the setup, we will dive deep into the core of TradingView crypto charting basics. This involves learning how to select and view different cryptocurrency pairs, such as BTC/USD or ADA/USDT, and understanding the importance of choosing the correct chart timeframe. We will explore how different timeframes can reveal different market perspectives, from long-term trends visible on daily or weekly charts to short-term opportunities identified on hourly or 15-minute charts. The goal is to equip you with the knowledge to perform basic but effective technical analysis on crypto charts.
Who Should Use TradingView for Cryptocurrency Trading
TradingView is an ideal tool for anyone involved in cryptocurrency trading, regardless of their experience level, but it is particularly beneficial for beginners. If you are just starting out and find the charting tools on your exchange limited, TradingView offers a significant upgrade in analytical capability. It provides a visual way to understand price history and patterns, which is far more effective than simply looking at a list of numbers.
Intermediate and advanced traders also rely heavily on TradingView for its sophisticated features, custom scripting capabilities (Pine Script), and social networking aspects. However, this guide focuses squarely on those new to the platform and potentially new to technical analysis altogether. If your goal is to move beyond simply buying and holding, and you want to learn how to analyze charts to make more strategic trading decisions, mastering TradingView crypto charting basics is a necessary step, and this guide is for you.
Getting Started with TradingView: Setting Up Your Workspace
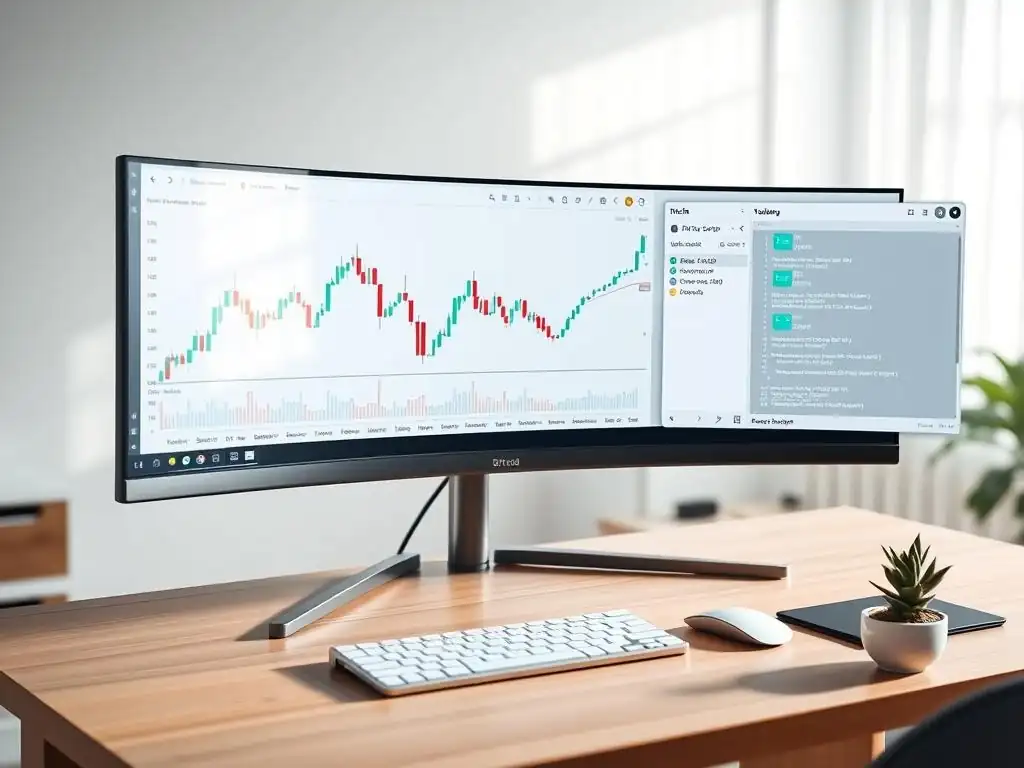
Before you can begin analyzing crypto charts, you need to get set up on the TradingView platform. The process is straightforward, and the platform offers a free tier that is more than sufficient for beginners to start learning TradingView crypto charting basics. While paid plans offer additional features like more indicators per chart or multiple charts per layout, the free account provides access to the essential charting tools and data you need to get started.
Setting up your workspace involves more than just signing up; it also includes familiarizing yourself with the platform's interface. Understanding where different tools, menus, and data panels are located will significantly speed up your workflow and allow you to focus on the analysis itself rather than searching for features. A well-organized workspace is key to efficient charting and analysis.
Signing Up for Your Free TradingView Account
Signing up for a free TradingView account is the first step. Navigate to the TradingView website and look for the 'Join for free' or 'Get started' option, typically found in the top right corner. You can sign up using your email address, or often via popular social media accounts like Google, Facebook, or Twitter for quicker access. The free account is labeled as the 'Essential' plan in some contexts, offering core features necessary for basic charting.
Upon successful signup, you will gain access to the platform. The free account allows you to use one chart per layout, apply up to three indicators per chart, and access basic watchlists and alert features. While there are limitations compared to paid plans (like Pro, Pro+, or Premium), these features are ample for beginners learning TradingView crypto charting basics and practicing technical analysis on various crypto pairs like BTC/USD or ETH/USDT. You can always upgrade later if you require more advanced functionality.
Once logged in, you'll be presented with the main TradingView interface, which can seem a bit overwhelming at first glance due to the sheer number of options. The interface is generally organized into several key areas: a top toolbar for chart settings and tools, a left-side toolbar for drawing tools, a right-side panel for watchlists, alerts, news, and social features, a bottom panel for timeframes, indicators, and the Pine Script editor, and the large central chart area.
Familiarizing yourself with these areas is crucial for efficient navigation. For instance, changing the cryptocurrency symbol or selecting a different exchange data feed is typically done via the search bar near the top left. Adding indicators involves clicking the 'Indicators' button, usually found in the top toolbar. Spending a few minutes exploring these different panels and toolbars will significantly improve your ability to utilize TradingView for your crypto charting basics.
Understanding the Layout: Panels and Chart Area
The core of the TradingView interface is the chart area, which occupies the largest portion of the screen. This is where the price data for your selected cryptocurrency pair is displayed visually, typically as candlesticks or lines. Around this central area are various panels that provide additional information and tools.
The right-side panel, for example, houses your watchlist, which you can customize to track specific crypto assets like XRP, Litecoin (LTC), or Cardano (ADA). It also includes tabs for news related to the displayed asset, a calendar of economic events (less relevant for pure crypto but useful for macro context), and the social stream where users share analysis ideas.
The bottom panel is equally important, containing options for selecting timeframes (e.g., 1h, 4h, 1D), adding and managing indicators, and accessing the Pine Script editor for creating custom indicators or strategies. The left-side drawing toolbar provides access to tools like trend lines, Fibonacci retracements, price ranges, text annotations, and shapes, which are essential for marking up your charts during analysis. Understanding the function of each of these panels is key to effectively using TradingView crypto charting basics for your trading endeavors.
Mastering TradingView Crypto Charting Basics
Mastering TradingView crypto charting basics involves understanding how to access and interpret the price data presented on the charts. This begins with selecting the specific cryptocurrency pair you wish to analyze and then choosing the appropriate timeframe for your trading strategy. These two steps are fundamental to any technical analysis performed on the platform.
The ability to quickly switch between different assets and timeframes allows traders to gain various perspectives on market movements. A trend that looks significant on a 4-hour chart might appear as minor noise on a daily chart, or vice versa. Developing the skill to use these features effectively is a cornerstone of utilizing TradingView for crypto analysis.
How to Select Cryptocurrency Pairs (e.g., BTC/USD, ETH/USDT)
Selecting a cryptocurrency pair on TradingView is straightforward. Locate the symbol search bar, usually found in the top-left corner of the platform interface. Click on it, and a dropdown menu will appear. In the search box within this menu, start typing the ticker symbol of the cryptocurrency you are interested in, such as "BTC" for Bitcoin or "ETH" for Ethereum.
As you type, TradingView will display a list of matching symbols from various exchanges. For example, searching "BTC/USD" might show results from Coinbase, Binance, Kraken, and others. It's important to select the pair from the exchange whose data you trust or are trading on, as prices can vary slightly between platforms. Similarly, searching for "ETH/USDT" will list Ethereum priced against the Tether stablecoin from multiple exchanges. This simple search functionality is the gateway to analyzing any of the thousands of crypto pairs available on TradingView, forming a core part of TradingView crypto charting basics.
Choosing the Right Chart Timeframe (e.g., Daily, Hourly, 15-Minute)
Choosing the right chart timeframe is critical as it determines the level of detail you see in price movements and influences the type of analysis you can perform. Timeframes are available in the bottom panel of the chart area and range from very short intervals like seconds or minutes (e.g., 1m, 5m, 15m) to longer periods like hours, days, weeks, or even months (e.g., 1h, 4h, 1D, 1W, 1M). Each candlestick or bar on the chart represents the price activity within that specific timeframe.
Your choice of timeframe should align with your trading style. Scalpers or day traders looking for short-term opportunities might focus on lower timeframes like the 5-minute or 15-minute charts. Swing traders holding positions for days or weeks typically use hourly (1h, 4h) or daily (1D) charts to identify trends and key support/resistance levels. Long-term investors analyzing the broader market structure often rely on weekly (1W) or monthly (1M) charts. Understanding how to switch between and analyze different timeframes is a fundamental aspect of mastering TradingView crypto charting basics.
Frequently Asked Questions
What is TradingView and why is it useful for crypto trading?
TradingView is a popular charting and analysis platform used by traders worldwide. It's useful for crypto trading because it provides access to real-time price data, technical indicators, and a community for sharing ideas.
How can I set up a basic crypto chart on TradingView?
To set up a chart, search for the crypto asset you want to analyze (e.g., BTC/USD) in the search bar. Then, select an exchange and the chart will load. You can customize the chart's appearance and add indicators.
What are some essential technical indicators for crypto beginners to use on TradingView?
Beginners can start with moving averages to identify trends, the Relative Strength Index (RSI) to gauge momentum, and volume analysis to confirm price movements.
How can I use TradingView to identify potential trading opportunities in the crypto market?
Look for patterns on the charts like support and resistance levels, trend lines, and chart patterns (e.g., head and shoulders). Use indicators to confirm these patterns and identify potential entry and exit points.
What are some of the free features on TradingView that are most helpful for crypto analysis?
The free plan offers access to a wide range of charts, indicators, and drawing tools. You can also join the community to follow other traders and learn from their analysis, all without needing a paid subscription.
The ability to decipher market signals is no longer a luxury, but a necessity in today's rapidly evolving financial landscape. Mastering the basics of TradingView, as a foundational skill, empowers crypto newcomers to navigate the often-turbulent waters of digital assets with greater confidence and informed decision-making. This guide has aimed to demystify the platform, providing a stepping stone towards a more sophisticated understanding of market dynamics.
The impact of accessible charting tools like TradingView extends far beyond individual trading strategies. It democratizes market analysis, allowing anyone with an internet connection to participate in informed discussions and challenge established narratives. This empowerment is crucial for fostering a more transparent and equitable financial ecosystem. The best time to plant a tree was 20 years ago. The second best time is now.
- Chinese Proverb. This quote perfectly encapsulates the sentiment: it's never too late to begin learning and applying these essential skills.
Now, armed with the knowledge from this guide, I encourage you to explore TradingView's features, experiment with different indicators, and develop your own unique charting style. Don't be afraid to make mistakes; they are invaluable learning opportunities. Embrace the journey of continuous learning and refinement, and you will find yourself not only navigating the crypto markets with greater skill, but also contributing to a more informed and empowered community.
Unlock Your Trading Potential: Master TradingView Today!
Thank you for exploring the world of TradingView with us! We hope this guide has boosted your confidence to start charting and analyzing cryptocurrencies like a seasoned trader. Now, it’s time to put your knowledge into action!
Ready to take the next step?
- Create your first TradingView chart! Sign up for an account and begin exploring different crypto assets. This is the most valuable step you can take right now.
- Share this guide with a friend who’s new to crypto and help them start their charting journey. Together, you can avoid common beginner mistakes!
- Try out a lesser-known indicator—test its usefulness and keep notes in your trading journal to see how it performs.
Which crypto asset will you chart first, and what makes it interesting to you? Share your plans in the comments below!
Leave a Reply