
Analyzing Bitcoin Price Charts: Technical Analysis for Investment Decisions


Welcome to Blockchain Trends, your guide to understanding the vast and evolving world of blockchain technology! Forget just cryptocurrencies – we're diving deep into DeFi, enterprise solutions, and the future of decentralized systems. Intrigued by the recent volatility? Our in-depth article on Bitcoin price chart analysis offers crucial insights. But that's just the beginning. Discover how technical analysis can inform your investment decisions and much more as you explore the transformative potential of blockchain with us.
- Mastering Core Concepts in Bitcoin Technical Analysis
-
Frequently Asked Questions
- What is the primary focus of technical analysis when analyzing a Bitcoin price chart?
- How can a Bitcoin price chart analysis help in making investment decisions?
- What are some common technical indicators used in Bitcoin price chart analysis?
- Does Bitcoin price chart analysis guarantee accurate predictions of future Bitcoin prices?
- What are some limitations to consider when relying solely on Bitcoin price chart analysis?
- Final Reflection: Navigating the Volatility of Bitcoin
- Unlock Your Bitcoin Trading Potential!
Mastering Core Concepts in Bitcoin Technical Analysis
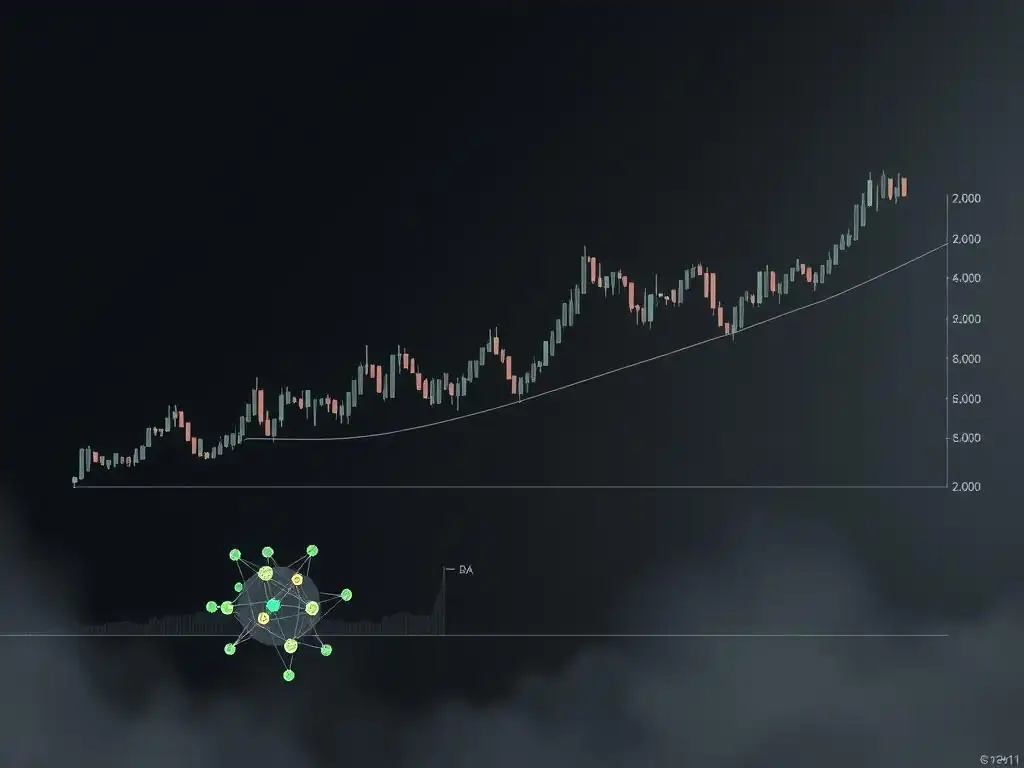
Identifying Key Support and Resistance Levels on Bitcoin Charts
Identifying support and resistance levels is a fundamental aspect of effective Bitcoin price chart analysis. These levels represent price points or zones where buying or selling pressure is historically strong enough to potentially halt or reverse the prevailing trend. Support levels are price points where a downtrend is expected to pause due to a concentration of buying interest, while resistance levels are points where an uptrend is expected to pause due to a concentration of selling interest. Recognizing these areas on a Bitcoin chart provides critical insights into potential turning points and price boundaries.
Analyzing historical Bitcoin price chart data reveals recurring patterns where price action reacts significantly at specific levels. For instance, during the 2021 bull run, the $60,000 to $65,000 area acted as a strong resistance zone multiple times before eventually being broken. Conversely, following the peak, levels around $30,000 and $20,000 provided significant support during subsequent downturns in 2021 and 2022, respectively.
These levels are not exact lines but often represent zones, and their strength is often indicated by the number of times the price has reacted to them. Traders performing Bitcoin price chart analysis often draw horizontal lines on their charts to mark these key levels, using them to anticipate potential price movements and set entry or exit points for trades.
Understanding Technical Indicators for Bitcoin Charts
Technical indicators are mathematical calculations based on historical price, volume, or open interest data, used by traders to forecast potential future price movements when analyzing Bitcoin price charts. These tools help simplify complex price action into visual signals and provide objective data points to support trading decisions. While no single indicator is foolproof, combining several can offer a more comprehensive view of market sentiment, momentum, and potential trend changes. Common indicators include Moving Averages (MA), Relative Strength Index (RSI), Moving Average Convergence Divergence (MACD), and Bollinger Bands.
Applying technical indicators to Bitcoin price chart analysis can reveal insights not immediately obvious from raw price data. For example, a popular approach involves using Moving Averages to identify trend direction and potential reversals; a shorter-term MA crossing above a longer-term MA (like the 50-day over the 200-day MA, often called a "golden cross") is frequently interpreted as a bullish signal. Similarly, the RSI, which measures the speed and change of price movements, can indicate overbought or oversold conditions.
An RSI reading above approximately 70 on a Bitcoin chart might suggest the asset is overbought and due for a pullback, while a reading below approximately 30 could signal it is oversold and potentially ready for a bounce. Integrating these indicators into your Bitcoin price chart analysis provides additional layers of confirmation for potential trade setups.
Frequently Asked Questions
What is the primary focus of technical analysis when analyzing a Bitcoin price chart?
The primary focus is on identifying patterns and trends in historical price data and trading volume to predict future price movements. It relies on the belief that market history repeats itself.
How can a Bitcoin price chart analysis help in making investment decisions?
By interpreting chart patterns and using technical indicators, investors can identify potential entry and exit points. This helps to optimize risk management and improve the probability of profitable trades.
What are some common technical indicators used in Bitcoin price chart analysis?
Common indicators include Moving Averages, Relative Strength Index (RSI), and MACD (Moving Average Convergence Divergence). These indicators provide insights into price momentum, overbought/oversold conditions, and potential trend reversals.
Does Bitcoin price chart analysis guarantee accurate predictions of future Bitcoin prices?
No, technical analysis is not foolproof. While it can provide valuable insights, it's important to remember that market conditions are always evolving and that no analysis guarantees future price predictions.
What are some limitations to consider when relying solely on Bitcoin price chart analysis?
Limitations include disregarding fundamental factors like news events, regulatory changes, and adoption rates. Over-reliance can lead to false signals and missed opportunities.
The insights gleaned from Bitcoin price chart analysis are more critical now than ever. In a world increasingly driven by digital assets and decentralized finance, understanding the patterns and signals within these charts is no longer just for seasoned traders; it's becoming a fundamental skill for anyone navigating the modern financial landscape. The volatility inherent in Bitcoin demands a proactive and informed approach, and technical analysis provides the tools to make more reasoned investment decisions.
The ongoing influence of Bitcoin on the global economy is undeniable, and its price charts serve as a living record of its journey, reflecting both triumphs and tribulations. My own fascination with these charts stems from the belief that they offer a glimpse into the collective psychology of the market, a tangible representation of fear and greed. The market is a pendulum that forever swings between sustainable optimism and unjustified pessimism.
- Benjamin Graham. This quote perfectly encapsulates the emotional forces at play, forces that are vividly illustrated in the peaks and valleys of a Bitcoin price chart.
Now, I invite you to reflect on your own relationship with Bitcoin and the broader world of cryptocurrency. Armed with the knowledge of technical analysis, consider how you can approach these markets with greater confidence and clarity. Embrace the challenge of deciphering the signals, and use them to make informed decisions that align with your financial goals. The future of finance is unfolding before our eyes, and understanding Bitcoin price chart analysis is a crucial step towards navigating it successfully.
Unlock Your Bitcoin Trading Potential!
Thank you for exploring the world of Bitcoin price charts. We hope you've gained valuable insights into how technical analysis can help you make informed investment decisions. Now, it's time to apply that knowledge!
Here are some ways to continue your journey:
- Start tracking Bitcoin price movements using the techniques discussed, focusing on identifying key support and resistance levels. This is where your learning truly begins!
- Share this article with fellow crypto enthusiasts on your favorite platforms to spark discussions and learn from each other's perspectives. Knowledge grows when shared!
- Explore our archive of technical analysis guides for various cryptocurrencies. You might discover hidden opportunities ready for strategic investment!
What is the first chart pattern you're planning to analyze, and what insights do you hope to gain? Share your thoughts in the comments below!
Leave a Reply