
Reading Candlestick Charts for Crypto Beginners: Visualizing Price Action

Welcome to Blockchain Trends, your go-to resource for unraveling the transformative power of blockchain! Are you ready to move beyond the hype and delve into the real-world applications of this revolutionary technology? Today, we're demystifying a crucial skill for any crypto enthusiast: reading candlestick charts. Unlock the secrets hidden within these visual patterns and gain a deeper understanding of candlestick chart crypto basics, empowering you to make more informed trading decisions. Intrigued? Let's dive in and discover how these seemingly simple charts can reveal the pulse of the market!
- Understanding Candlestick Chart Crypto Basics for Beginners
- What Are Candlestick Charts? A Simple Explanation
- Anatomy of a Crypto Candlestick: Reading the Signals
-
Frequently Asked Questions
- What exactly is a candlestick chart, and why is it used in crypto trading?
- What are the main components of a candlestick and what do they represent?
- How can I use candlestick patterns to identify potential buy or sell signals in the crypto market?
- What timeframes are typically used when analyzing candlestick charts for crypto trading, and why?
- Are candlestick charts foolproof, or are there limitations to using them for crypto trading?
- Final Reflection: Illuminating the Path Forward in Crypto
- Unleash Your Inner Crypto Analyst!
Understanding Candlestick Chart Crypto Basics for Beginners
Why Visualizing Price Action is Crucial in Crypto Trading
Visualizing price action is fundamental when navigating the volatile crypto markets. Unlike traditional asset classes, cryptocurrencies often experience rapid and significant price swings within short periods. For instance, Bitcoin (BTC) or Ethereum (ETH) can see price movements of 5-10% or even more within a single day, driven by news, market sentiment, or technical factors.
Relying solely on numerical data feeds can make it challenging to quickly grasp the momentum, range, and sentiment behind these movements. Understanding candlestick chart crypto basics provides traders with a visual shorthand, allowing them to process vast amounts of historical and real-time price data efficiently. This visual understanding helps identify potential entry and exit points, assess market strength or weakness, and make informed decisions more rapidly than poring over spreadsheets of data points.
Furthermore, effective price visualization through tools like crypto candlestick charts enables beginners to develop a sense of market rhythm and context. It's not just about knowing what the price is, but how it got there within a specific timeframe. Was the price rejected sharply after hitting a certain level? Did it consolidate for hours before a breakout?
These nuances are immediately apparent on a well-constructed candlestick chart. For someone just starting their journey understanding candlestick chart crypto basics, this visual approach demystifies complex market dynamics, transforming abstract numbers into a compelling narrative of supply and demand forces at play. This foundational skill is essential for anyone serious about trading digital assets, providing the necessary context to apply more advanced technical analysis techniques later on.
The Challenge: Decoding Crypto Charts as a Beginner
For newcomers to the crypto space, the sheer volume and complexity of trading charts can be overwhelming. Opening a trading platform often presents a screen filled with lines, bars, indicators, and numbers that appear indecipherable at first glance. The primary challenge in understanding candlestick chart crypto basics lies in moving past this initial visual noise to identify the core components that convey meaningful information.
Unlike simple line charts that only show closing prices over time, candlestick charts pack four crucial data points (open, high, low, close) into each 'candle,' multiplied across various timeframes (e.g., 1-minute, 1-hour, 1-day). Learning to interpret this density of information requires dedicated effort and practice.
Another significant hurdle is distinguishing between different chart patterns and understanding their potential implications within the context of crypto's unique market behavior. While traditional chart analysis principles apply, crypto markets can be heavily influenced by global, 24/7 trading, social media trends, and rapid technological developments, sometimes leading to less predictable pattern outcomes compared to traditional stocks or commodities.
Beginners often struggle to avoid "analysis paralysis" – becoming overwhelmed by too much data or too many potential interpretations. Mastering the art of reading crypto charts starts with focusing on the fundamental building blocks, such as individual candles and basic patterns, before attempting to integrate more complex indicators or strategies.
What Are Candlestick Charts? A Simple Explanation
Beyond Line Charts: How Candlesticks Tell a Story
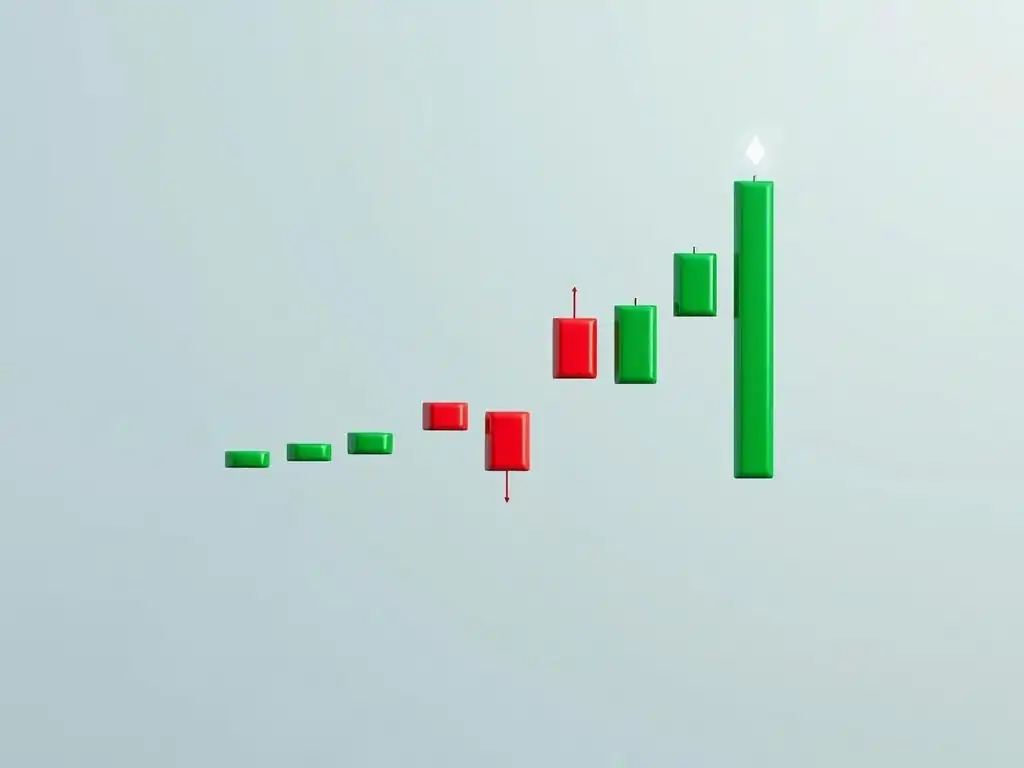
Candlestick charts offer a richer, more nuanced view of price action compared to basic line charts. While a line chart simply connects the closing prices over time, showing a smooth trend, a candlestick chart provides a snapshot of price movement within a specific period. Each "candlestick" represents the price activity over that duration – whether it's one minute, one hour, one day, or longer.
This single visual element encapsulates the opening price, the highest price reached, the lowest price hit, and the closing price for that period. This allows traders, even beginners understanding candlestick chart crypto basics, to quickly ascertain the range of price movement and whether the closing price was higher or lower than the opening price, indicating bullish or bearish sentiment during that specific timeframe.
The distinct structure of a candlestick, with its "body" and "wicks" (or "shadows"), is key to its storytelling ability. The body of the candle represents the range between the opening and closing prices.
A green (or white) body typically signifies that the closing price was higher than the opening price (a bullish candle), while a red (or black) body indicates the closing price was lower than the opening price (a bearish candle). The wicks extending above and below the body show the highest and lowest prices reached during the period, regardless of the open and close.
By examining the length and position of the body and wicks, traders can infer market volatility, potential price rejection at certain levels, and the strength of buying or selling pressure within that period. This detailed information, unavailable on a simple line chart, is crucial for understanding candlestick chart crypto basics and making informed trading decisions.
The Origin of Candlesticks and Their Relevance Today
The concept of candlestick charting dates back to 18th-century Japan, developed by Munehisa Homma, a rice merchant. Homma used these charts to track rice prices, recognizing that market sentiment and trader psychology were as important as the basic supply and demand figures. His methods were revolutionary for their time, providing a visual representation of price patterns that reflected emotional states of the market participants.
While Homma's original system was based on rice futures, his fundamental principles of visualizing price movement through open, high, low, and close data points proved highly adaptable. These techniques were later introduced to the Western world by Steve Nison in the late 1980s, quickly gaining popularity among financial traders across various markets.
Today, candlestick charts are a cornerstone of technical analysis in virtually every financial market, including the highly dynamic cryptocurrency space. Their relevance in crypto is arguably even more pronounced due to the market's inherent volatility and the significant role of trader sentiment. Understanding candlestick chart crypto basics allows participants to tap into a globally recognized language of market behavior.
The patterns formed by single candlesticks or combinations of several candles (like Doji, Hammer, Engulfing patterns) are still widely used by traders worldwide to identify potential trend reversals, continuations, and market indecision. Despite the technological advancements in trading platforms, the core visual efficiency and psychological insights offered by Homma's centuries-old method remain invaluable for anyone reading crypto charts.
Anatomy of a Crypto Candlestick: Reading the Signals
Understanding the basic components of a single candlestick is the absolute starting point for reading crypto charts effectively. Every candlestick, regardless of the timeframe it represents (e.g., a 1-hour candle for BTC/USD or a 1-day candle for ETH/USDT), is composed of two main parts: the body and the wicks (also known as shadows). The body is the thicker rectangular part, and its color immediately signals whether the price increased or decreased during the period.
A green (or often white) body means the closing price was higher than the opening price, indicating bullish sentiment for that period. Conversely, a red (or often black) body means the closing price was lower than the opening price, signaling bearish sentiment. The length of the body shows the strength of the price movement; a long body suggests strong buying or selling pressure, while a short body indicates minimal price change or indecision.
Extending above and below the body are the thin lines called wicks or shadows. The upper wick indicates the highest price reached during the period, while the lower wick shows the lowest price. These wicks provide critical information about price extremes and potential rejection levels.
For example, a long upper wick with a short body might suggest that buyers initially pushed the price up significantly, but sellers stepped in aggressively to push it back down before the period closed. Similarly, a long lower wick can indicate that sellers drove the price down, but buyers emerged to push it back up. Analyzing the relationship between the body and the wicks is crucial for understanding candlestick chart crypto basics, as it helps reveal the battles between buyers and sellers and potential turning points in price action.
Frequently Asked Questions
What exactly is a candlestick chart, and why is it used in crypto trading?
A candlestick chart is a visual representation of price movements over a specific period. It's used in crypto trading to analyze price trends and potential trading opportunities more effectively than simple line charts.
What are the main components of a candlestick and what do they represent?
Each candlestick has a body (representing the open and close prices) and wicks (representing the highest and lowest prices). A green or white body indicates a price increase, while a red or black body indicates a price decrease during the period.
How can I use candlestick patterns to identify potential buy or sell signals in the crypto market?
Specific candlestick patterns, like the hammer or shooting star, can suggest potential reversals in price trends. Recognizing these patterns can help traders make informed decisions about buying or selling.
What timeframes are typically used when analyzing candlestick charts for crypto trading, and why?
Common timeframes include 1-minute, 5-minute, 15-minute, hourly, daily, and weekly. Shorter timeframes are used for day trading, while longer timeframes are used for longer-term investment strategies.
Are candlestick charts foolproof, or are there limitations to using them for crypto trading?
Candlestick charts are valuable tools, but they are not foolproof. It's important to use them in conjunction with other technical indicators and fundamental analysis. They should be used as part of a comprehensive trading strategy, not in isolation.
Final Reflection: Illuminating the Path Forward in Crypto
The ability to decipher candlestick charts, as we've explored, is more than just a technical skill; it's a fundamental language for navigating the volatile world of cryptocurrency. Understanding candlestick chart crypto basics empowers beginners to move beyond speculation and engage with the market on a more informed and strategic level. In a space often dominated by hype and fear, this knowledge provides a crucial anchor, allowing for reasoned decision-making based on visualized price action.
This journey into candlestick patterns has, I believe, a deeper resonance. It underscores the importance of continuous learning and adaptation in a rapidly evolving landscape like crypto. The ability to read these charts isn't just about predicting the next price swing; it's about understanding the underlying market sentiment and the collective psychology of buyers and sellers. The market is a device for transferring money from the impatient to the patient.
- Warren Buffett. This quote perfectly encapsulates the value of patience and informed decision-making that candlestick chart analysis can foster.
Now, armed with this foundational knowledge, I urge you to embrace the power of visual analysis in your crypto journey. Don't be intimidated by the complexity; start small, practice diligently, and allow the patterns to reveal their stories. Let the candlesticks illuminate your path, guiding you towards more informed and ultimately, more successful investment decisions. The future of your crypto endeavors lies in your ability to learn, adapt, and visualize the market's ever-changing narrative.
Unleash Your Inner Crypto Analyst!
Thanks for exploring candlestick charts with us! We hope this article has shown how these visual tools can help you better understand crypto price movements. Now, it's time to put that knowledge into practice.
- Start practicing! Use a free crypto charting platform to analyze your favorite cryptocurrencies using the techniques you've learned. Look for the patterns we discussed.
- Join our community forum to share your first candlestick analysis, ask questions, get feedback, and connect with other beginners.
- Explore advanced candlestick patterns like the evening star or hammer to deepen your understanding of market sentiment.
Which cryptocurrencies are you analyzing with candlestick charts right now, and what initial signals are you seeing? Share your findings in the comments below!
Leave a Reply