
Visualizing Blockchain Data: Explorers with Charts, Graphs & Network Maps


Welcome to Blockchain Trends, your go-to source for understanding the revolutionary power of blockchain beyond the hype. Ever wondered how to truly see the intricate workings of this technology? Dive in as we explore the fascinating world of blockchain data visualization tools. Unlock hidden insights, map network activity, and uncover the stories behind the data. Ready to transform raw blockchain data into actionable intelligence? Let's begin!
- The Challenge of Understanding Raw Blockchain Data
- The Power of Blockchain Data Visualization Tools
- Top Blockchain Data Visualization Tools & Explorers
-
Frequently Asked Questions
- What are Blockchain data visualization tools, and why are they important?
- How do Blockchain explorers enhance data visualization?
- What types of data can be visualized using Blockchain data visualization tools?
- How can "Blockchain data visualization tools" be used in the enterprise?
- What are some examples of advanced visualization techniques used in Blockchain analysis?
- Final Reflection: Illuminating the Blockchain's Depths
- Uncover Hidden Insights: Dive Deeper into Blockchain Data!
The Challenge of Understanding Raw Blockchain Data
Why Traditional Explorers Fall Short for Complex Analysis
Blockchain explorers have become essential tools for anyone interacting with blockchain technology. Initially designed to provide transparency into transactions, blocks, and addresses, these explorers primarily present data in a tabular format. While incredibly useful for basic tasks like checking transaction status or verifying balances, traditional explorers often fall short when it comes to complex analysis.
Imagine trying to understand the intricate flow of assets within a decentralized finance (DeFi) protocol using only transaction lists. These lists, even with filters, quickly become overwhelming when dealing with smart contract interactions involving multiple parties and nested transactions.
The linear, row-based presentation of data in typical explorers struggles to convey the nuanced relationships and dynamic changes occurring within blockchain networks, particularly as these networks grow in complexity and scale. For instance, analyzing the impact of a specific smart contract upgrade or identifying patterns of illicit fund movements across multiple addresses becomes a laborious and often impractical task with standard explorer interfaces.
Furthermore, the sheer volume of data on public blockchains like Ethereum or Bitcoin presents a significant hurdle. Millions of transactions occur daily, and traditional explorers, while providing access to this data, do not offer effective mechanisms for synthesizing and interpreting it at scale. Consider the challenge of identifying trends in Non-Fungible Token (NFT) trading activity.
A traditional explorer might allow you to see individual NFT sales, but discerning broader market trends, identifying influential collections, or understanding the relationships between different marketplaces requires a more sophisticated approach than simply scrolling through transaction histories. The limitations of traditional explorers become increasingly apparent as users attempt to move beyond basic data retrieval and engage in deeper, more insightful blockchain data analysis.
The Need for Visualizing Blockchain Data Beyond Simple Transactions
The evolution of blockchain technology, particularly with the rise of DeFi and complex enterprise applications, has created a pressing need to move beyond simple transaction-centric data exploration. Understanding the intricate dynamics of these systems requires visualizing blockchain data in ways that reveal patterns, relationships, and trends that are simply invisible in raw data tables.
Think about the interconnectedness of DeFi protocols; assets flow between lending platforms, decentralized exchanges, and yield aggregators, creating a complex web of interactions. Visualizing these flows as a network graph, for example, can instantly highlight key hubs of activity, identify potential systemic risks, and reveal the overall health of the DeFi ecosystem in a way that tables of transactions cannot.
Moreover, the ability to visualize blockchain data is crucial for identifying anomalies and security threats. Suspicious patterns, such as sudden spikes in transaction volume to or from specific addresses, or unusual concentrations of assets, can be quickly detected through visual representations. Imagine a security analyst trying to identify potential wash trading on a decentralized exchange.
Manually sifting through thousands of trades in a traditional explorer would be incredibly time-consuming and error-prone. However, visualizing trade data as a time-series chart or a scatter plot can immediately reveal patterns indicative of wash trading, allowing for faster and more effective threat detection and mitigation. The shift towards visualizing blockchain data reflects a growing need to understand not just what transactions are occurring, but also how they are interconnected, why certain patterns emerge, and ultimately, to extract meaningful insights from the vast ocean of blockchain information.
The Power of Blockchain Data Visualization Tools
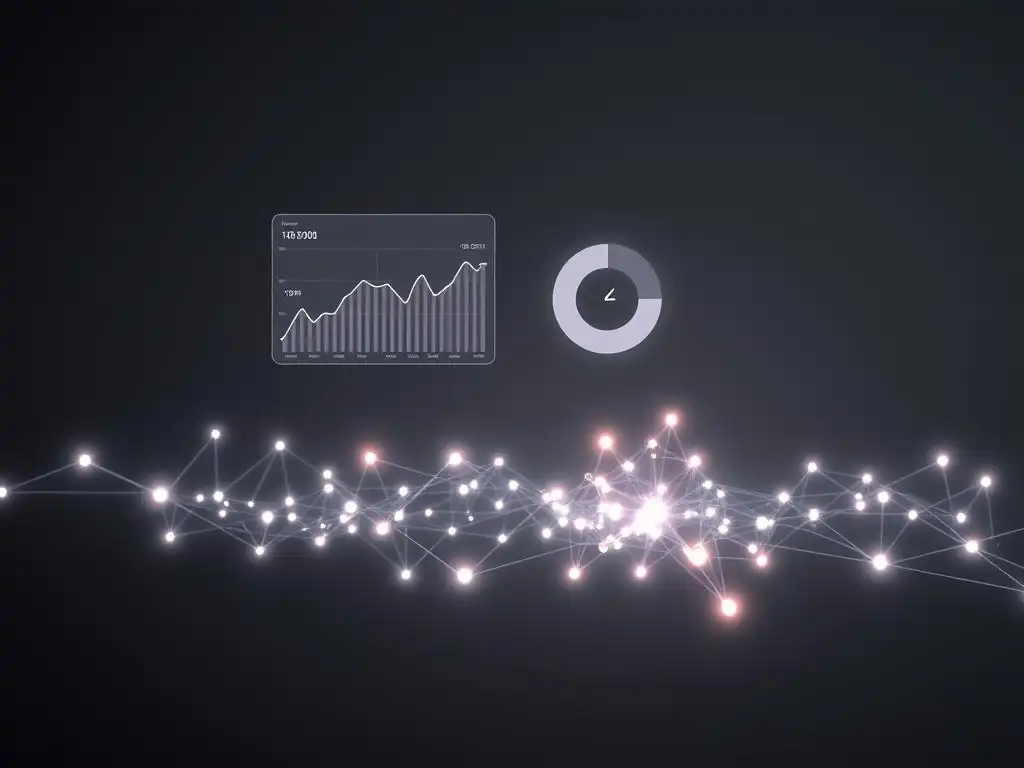
How Visualizations Unlock Insights in Blockchain Networks
Blockchain data visualization tools empower users to unlock profound insights hidden within the complexities of blockchain networks. By transforming raw data into visual formats like charts, graphs, and network maps, these tools facilitate pattern recognition, trend identification, and anomaly detection with unparalleled efficiency. Consider the task of analyzing the distribution of tokens within a specific cryptocurrency project.
Presenting this data as a pie chart or a histogram instantly reveals the concentration of token ownership, highlighting potential centralization risks or the effectiveness of token distribution strategies. This kind of insight is incredibly difficult to glean from simply examining raw address balances in a traditional explorer.
Furthermore, visualizations allow for the exploration of temporal trends in blockchain data. Time-series charts showing transaction volume, gas prices, or active addresses over time can reveal cyclical patterns, market responses to events, and the overall growth trajectory of a blockchain network. For example, visualizing the daily transaction count on a blockchain alongside major news events or protocol upgrades can provide valuable context and help understand the drivers of network activity.
The ability to interact with these visualizations, zooming in on specific time periods or filtering data based on different criteria, further enhances the analytical process, allowing users to explore blockchain data dynamically and uncover nuanced insights that would remain hidden in static tables or lists. Blockchain data visualization tools transform raw data into a digestible and actionable format, democratizing access to complex blockchain analytics and empowering users to make data-driven decisions.
Different Types of Blockchain Visualization: Charts, Graphs, and Network Maps
Blockchain data visualization tools employ a variety of visual formats, each suited for different types of data and analytical objectives. Charts, such as line charts, bar charts, and pie charts, are excellent for displaying quantitative data and comparing values across different categories or time periods. For instance, a bar chart could effectively compare the average transaction fees across different blockchain networks, while a line chart could track the price volatility of a cryptocurrency over time.
Graphs, particularly network graphs, are invaluable for visualizing relationships and connections within blockchain networks. These can represent the flow of funds between addresses, the interactions between smart contracts, or the relationships between users in a decentralized application.
Imagine a network graph visualizing the flow of funds through a DeFi protocol; each address could be a node, and transactions could be represented as edges, with the thickness of the edge indicating the transaction volume. This type of visualization can quickly reveal key players, identify liquidity pools, and highlight potential vulnerabilities in the protocol’s architecture.
Network maps offer a spatial representation of blockchain networks, although their application in data visualization is slightly different from network graphs. Network maps, in the context of blockchain data visualization, could represent the geographical distribution of nodes in a blockchain network (though this is less common in data analysis focused explorers) or, more effectively, visualize transaction pathways across different parts of a blockchain or even across multiple blockchains. For example, visualizing cross-chain asset transfers could be represented as a network map, showing the flow of assets between different blockchains and highlighting bridges or interoperability protocols used.
The choice of visualization type depends heavily on the specific questions being asked and the nature of the blockchain data being analyzed. Combining different visualization techniques within a single tool often provides the most comprehensive and insightful view of blockchain data.
Key Use Cases for Visualizing Blockchain Data (DeFi, Enterprise, Research)
The applications of blockchain data visualization tools are diverse and span across various sectors, particularly within DeFi, enterprise, and research. In DeFi, these tools are critical for understanding the complex interactions within decentralized protocols. Visualizing Total Value Locked (TVL) across different DeFi platforms, for example, allows investors and analysts to gauge the overall health and growth of the DeFi ecosystem.
Tools can also visualize the flow of assets within specific protocols, helping users understand yield farming strategies, identify impermanent loss risks, and track the performance of their investments. For instance, a dashboard visualizing the lending and borrowing rates across different DeFi lending platforms can empower users to make informed decisions about where to allocate their assets for optimal yield.
In the enterprise space, blockchain data visualization tools are increasingly used for supply chain management, provenance tracking, and audit trails. Imagine a company using blockchain to track the journey of goods through its supply chain. Visualizing this data as a flow chart or a geographic map can provide real-time visibility into the location and status of goods, identify bottlenecks, and improve supply chain efficiency.
Furthermore, visualizing audit trails on a blockchain can enhance transparency and accountability, allowing stakeholders to easily verify the integrity and history of data records. For example, in the pharmaceutical industry, visualizing the provenance of drugs on a blockchain can help combat counterfeiting and ensure the authenticity of medications. In research, blockchain data visualization tools are invaluable for academic studies and network analysis.
Researchers use these tools to analyze blockchain network behavior, identify emerging trends, and understand the socio-economic impact of blockchain technology. Visualizing transaction patterns, network congestion, and user adoption rates allows researchers to gain deeper insights into the dynamics of blockchain ecosystems and contribute to the advancement of blockchain technology.
Top Blockchain Data Visualization Tools & Explorers
Choosing the Right Tool for Your Needs
Selecting the right blockchain data visualization tool is crucial for effective analysis and depends heavily on your specific needs and objectives. Before choosing a tool, consider the type of blockchain data you need to analyze. Are you primarily interested in transaction data, smart contract interactions, tokenomics, or network performance? Some tools specialize in specific types of data and blockchains. For example, tools focused on DeFi data visualization might offer specialized metrics and visualizations relevant to DeFi protocols on Ethereum, while tools targeting enterprise applications might focus on permissioned blockchains and supply chain data.
Another important factor is your level of technical expertise and analytical goals. Are you a developer needing to debug smart contracts, a trader looking for market insights, or a researcher conducting in-depth network analysis? Some tools are designed for technical users and offer advanced features like custom queries and API access, while others are more user-friendly with pre-built dashboards and visualizations suitable for less technical users. Consider the visualization capabilities offered by different tools.
Do they provide the types of charts, graphs, and network maps that are most relevant to your analysis? Evaluate the data sources and blockchains supported by the tool. Ensure that the tool supports the blockchains and data sources that you need to access.
Finally, consider the pricing and accessibility of the tool. Some tools are open-source and free to use, while others are subscription-based with varying pricing tiers. Carefully evaluate your needs and compare different tools to choose the one that best fits your requirements and budget for effective blockchain data visualization and analysis.
Frequently Asked Questions
What are Blockchain data visualization tools, and why are they important?
Blockchain data visualization tools are software applications that present blockchain data in a graphical format, such as charts, graphs, and network maps. They are important because they make complex blockchain information more accessible and understandable, facilitating data analysis and insights.
How do Blockchain explorers enhance data visualization?
Blockchain explorers provide a user-friendly interface to access and browse transactional data. They often incorporate data visualization elements, like transaction graphs, to help users understand transaction flows and network activity more easily.
What types of data can be visualized using Blockchain data visualization tools?
These tools can visualize a wide range of data, including transaction volumes, block sizes, address balances, smart contract interactions, and network activity. They can also show the relationships between different addresses and transactions.
How can "Blockchain data visualization tools" be used in the enterprise?
Enterprises can use these tools for supply chain tracking, fraud detection, and regulatory compliance. Visualizing data helps them gain insights into blockchain-based processes and identify potential risks or inefficiencies.
What are some examples of advanced visualization techniques used in Blockchain analysis?
Advanced techniques include network mapping to visualize the relationships between nodes, heatmaps to identify areas of high activity, and time-series charts to track trends over time. These methods provide a deeper understanding of blockchain dynamics.
Final Reflection: Illuminating the Blockchain's Depths
The insights gleaned from exploring blockchain data visualization tools are not merely academic; they are essential for navigating the increasingly complex landscape of decentralized technologies. As blockchain continues to permeate industries from finance to supply chain management, the ability to understand and interpret its underlying data becomes paramount for informed decision-making and strategic innovation.
The profound impact of effective blockchain data visualization extends beyond technical analysis. It fosters transparency, builds trust, and empowers individuals to engage more meaningfully with this transformative technology. Witnessing the evolution of these tools has reinforced my belief in the power of accessible information to democratize knowledge and drive progress. Data is the new oil. It's valuable, but if unrefined it cannot really be used.
- Clive Humby. This quote perfectly encapsulates the need for effective visualization to unlock the true potential of blockchain data.
Now, consider how you can leverage these insights. Explore the blockchain data visualization tools discussed, experiment with different approaches, and contribute to the ongoing conversation surrounding data accessibility and transparency. The future of blockchain depends not only on its technological advancements but also on our collective ability to understand and interpret the stories hidden within its intricate web. Let us all strive to become more informed participants in this revolutionary technology.
Thank you for exploring the world of blockchain data visualization with Blockchain Trends! We hope this article illuminated how charts, graphs, and network maps can reveal valuable insights. Now, it’s time to apply that knowledge.
Here’s how you can continue your blockchain data journey:
- Explore a Blockchain Explorer: Select a blockchain explorer mentioned earlier and start visualizing transactions and blocks. Focus on a specific address or a recent block to understand the flow of data.
- Analyze a Specific Token: Choose a token and map out its holders to gain insights into distribution.
- Share Your Discoveries: Share this article with a friend or colleague interested in blockchain or data visualization! Help them see the power of visual blockchain data.
What interesting data trends or connections will you uncover? Share your initial findings in the comments below!
Leave a Reply