
Analyzing Your Crypto Trading Performance: A Beginner's Guide to SelfImprovement


Welcome to Blockchain Trends, your guide to navigating the evolving world of decentralized technology. Are you ready to unlock the secrets to optimizing your crypto trades? This week, we delve into the critical role of blockchain trading performance analysis tools in achieving consistent success. Discover how these powerful resources can transform your strategies and elevate your trading game. Curious to learn more? Dive in and start analyzing your crypto trading performance today!
- Introduction to Blockchain Trading Performance Analysis Tools
- Key Metrics for Evaluating Your Crypto Trading Performance
- Essential Blockchain Trading Performance Analysis Tools
- Step-by-Step Guide to Using Blockchain Trading Performance Analysis Tools
- Common Mistakes in Crypto Trading Performance Analysis
- Continuous Improvement: Strategies for Enhancing Blockchain Trading Performance
- Conclusion: The Path to Better Blockchain Trading Performance
-
Frequently Asked Questions
- How can blockchain trading performance analysis tools help me improve my trading?
- What are some key metrics to track when analyzing my blockchain trading performance?
- Can I use blockchain trading performance analysis tools even if I'm a beginner?
- Are there free blockchain trading performance analysis tools available, or do I need to pay for them?
- How can blockchain trading performance analysis tools help me manage risk in my crypto trading?
- Final Reflection: Mastering the Art of Crypto Trading
- Unlock Your Trading Potential: Start Analyzing Now!
Introduction to Blockchain Trading Performance Analysis Tools
Understanding the Importance of Performance Analysis in Crypto Trading
Engaging in cryptocurrency trading without tracking performance is akin to navigating without a compass. The volatile nature of the crypto market means that understanding the outcomes of your trades is not just beneficial, but essential for sustainable growth. Performance analysis allows traders, especially beginners, to move beyond guesswork and base their decisions on concrete data. It helps identify what trading strategies are working, which assets are performing well in their portfolio, and where capital might be being lost unnecessarily.
Analyzing trading performance provides clarity on a trader's strengths and weaknesses. For instance, a beginner might discover they have a high win rate on short-term trades but consistently lose money on long-term investments, or vice versa. Without dedicated analysis, these patterns remain hidden, making it difficult to adapt and improve. Utilizing Blockchain trading performance analysis tools automates the often complex process of aggregating transaction data from various exchanges and wallets, providing a consolidated view necessary for informed decision-making in the fast-paced crypto landscape.
Overview of Blockchain Trading Performance Analysis Tools Available
The market for Blockchain trading performance analysis tools has grown significantly alongside the adoption of cryptocurrencies. These tools range from simple spreadsheet templates to sophisticated software platforms designed to integrate with multiple exchanges and blockchains. Their primary function is to import, categorize, and analyze trading history, providing users with detailed reports on profitability, trading frequency, asset performance, and more. Some tools also offer features related to tax reporting, portfolio tracking, and even social trading insights.
These platforms cater to different levels of traders, from beginners needing basic profit/loss tracking to advanced users requiring complex charting and strategy backtesting features. While some tools are free with limited functionality, many offer subscription tiers based on the number of transactions or exchanges supported. The core value proposition of these crypto trading analysis tools lies in their ability to transform raw transaction data into actionable insights, enabling traders to understand the true financial outcome of their activities across various decentralized and centralized platforms.
Key Metrics for Evaluating Your Crypto Trading Performance
Profit and Loss Tracking: Understanding Your Gains and Losses
Profit and Loss (P&L) is the most fundamental metric in trading performance analysis. It measures the net financial outcome of your trading activities over a specific period. Tracking P&L involves calculating the difference between the total revenue generated from selling assets and the total cost incurred from buying them, including any trading fees. For a beginner, understanding simple P&L is the first step towards comprehending whether their overall trading strategy is profitable or resulting in losses. This metric can be viewed overall, per asset, or per specific trade.
Detailed P&L tracking goes beyond a simple sum. It often involves calculating realized P&L (profits/losses from closed positions) and unrealized P&L (potential profits/losses on open positions). Monitoring these figures over time reveals trends in profitability. For example, a trader might see consistent small realized gains but significant unrealized losses on positions they are holding long-term. Analyzing P&L with Blockchain trading performance analysis tools allows beginners to see aggregate results from diverse sources, providing a clearer picture than manually tracking scattered transactions across different platforms.
Win Rate: Evaluating Your Success Rate in Trades
Win rate is a metric that indicates the percentage of trades that resulted in a profit. It is calculated by dividing the number of winning trades by the total number of trades executed over a period and multiplying by 100. A high win rate suggests that a trader is successful in predicting market movements or executing profitable strategies more often than not.
For instance, if a trader makes 100 trades and 60 of them are profitable, their win rate is 60%. While a high win rate is desirable, it doesn't tell the whole story about profitability without considering the size of wins versus losses.
Analyzing your win rate helps identify the consistency of your trading approach. A low win rate combined with overall profitability might indicate a strategy that relies on infrequent, large wins. Conversely, a high win rate with overall losses suggests that winning trades are small, while losing trades are significantly larger. Many crypto trading analysis tools automatically calculate win rates per asset, strategy, or trading pair, offering granular insights into where success is most consistently achieved, allowing beginners to focus on their more successful approaches.
Risk-to-Reward Ratio: Analyzing Trade Effectiveness
The Risk-to-Reward Ratio (RRR) is a critical metric for assessing the potential profitability of a trade relative to the potential loss. It is calculated by dividing the potential loss (risk) by the potential profit (reward) for a given trade. For example, if a trader sets a stop-loss order that limits potential loss to $100 and a take-profit order that aims for a $200 gain, the RRR is 1:2 ($100 risk / $200 reward). A favorable RRR (e.g., 1:2 or higher) means that the potential profit outweighs the potential loss.
Analyzing the RRR of your trades helps determine if your strategy is statistically sound. Even with a win rate below 50%, a consistently favorable RRR can lead to overall profitability.
For instance, winning only 40% of trades with a 1:2 RRR means that for every 10 trades, you might lose $100 four times (total loss $400) but gain $200 six times (total gain $1200), resulting in a net profit of $800. Blockchain trading performance analysis tools can help track the average RRR across all trades, providing valuable perspective on the inherent risk profile and potential effectiveness of a trader's strategy over time.
Essential Blockchain Trading Performance Analysis Tools
Tool 1: CryptoTrader.Tax
Features and Benefits of Using CryptoTrader.Tax
CryptoTrader.Tax is a widely used Blockchain trading performance analysis tool primarily known for its robust tax reporting capabilities, but it also offers valuable performance tracking features. Its core strength lies in its ability to connect to a vast number of cryptocurrency exchanges (over 100 supported, including major ones like Coinbase, Binance, Kraken, and KuCoin) and wallets, automatically importing transaction data.
Users can import trades via API connections or by uploading CSV files. The platform then processes this data to calculate capital gains and losses, which is crucial for tax compliance but also serves as a direct measure of realized trading performance.
Beyond tax calculations, CryptoTrader.Tax provides basic performance reports such as total gains/losses, transaction history summaries, and cost basis tracking. While not as feature-rich for in-depth strategic analysis as some pure performance trackers, its seamless integration with numerous trading platforms and focus on accurate financial calculation makes it an excellent starting point for beginners who need to understand their bottom line and ensure compliance. The ease of data import is a significant benefit, reducing the manual effort required to consolidate trading activity from disparate sources.
How to Integrate CryptoTrader.Tax into Your Trading Strategy
Integrating CryptoTrader.Tax into your trading strategy primarily involves using it as a regular checkpoint for financial performance and tax planning. After executing trades over a period (e.g., monthly or quarterly), connect your exchanges and wallets or upload your transaction data. Allow the tool to process the information. Review the generated reports to understand your realized profits and losses for that period. This provides a clear financial snapshot of your trading outcomes, informing future capital allocation decisions.
For beginners, start by ensuring all your trading activities are captured. Use the API connections for exchanges you trade on frequently, and manually import data for any unsupported platforms or off-exchange transactions. Regularly reviewing the calculated gains and losses helps ground your trading in financial reality. For instance, if reports show consistent losses on a particular asset, it prompts a review of the strategy for that asset. While its primary focus is tax, the underlying data consolidation and calculation are fundamental aspects of effective Blockchain trading performance analysis.
Tool 2: CoinTracking
Comprehensive Overview of CoinTracking's Features
CoinTracking is one of the most comprehensive Blockchain trading performance analysis tools available, offering extensive features beyond just tax reporting. It supports a vast number of exchanges (reportedly over 110, plus various blockchain imports), allowing users to track trades from virtually anywhere. Key features include detailed reports on profit/loss across all assets and exchanges, real-time portfolio value tracking, realized and unrealized gains, average purchase prices, and transaction history summaries. It also provides specific metrics like daily gains, fees paid, and asset distribution.
What sets CoinTracking apart is its depth of analysis. Users can view historical charts of their portfolio value, analyze specific trade pairs, and track the impact of fees on overall profitability. It offers various reporting options, including different calculation methods for cost basis (like FIFO, LIFO, HIFO) which impact both performance metrics and tax outcomes. The platform's ability to handle complex scenarios like margin trading, futures, and staking rewards makes it a powerful tool for traders whose activities extend beyond simple spot trading.
Leveraging CoinTracking for Enhanced Performance Insights
Leveraging CoinTracking for enhanced performance insights involves utilizing its detailed reporting capabilities. Instead of just looking at overall P&L, drill down into specific aspects of your trading. Use the 'Realized & Unrealized Gains' report to understand the performance of both closed and open positions. Analyze the 'Trade Statistics' to see win rates, average trade duration, and profitability per exchange or coin. The 'Fees Report' can highlight the impact of trading costs, prompting a potential switch to platforms with lower fees if significant.
For beginners, start by ensuring all your data is imported accurately. Then, use the dashboard and basic reports to get a feel for your overall performance. As you become more comfortable, explore the more granular reports. For example, if you trade multiple altcoins, use the asset-specific reports to see which ones are contributing most to your profits (or losses). This level of detail, facilitated by robust Blockchain trading performance analysis tools like CoinTracking, allows traders to identify specific areas for improvement or capitalize on successful strategies.
Tool 3: TradingView
Analyzing TradingView’s Charting and Analysis Features
TradingView is widely recognized not primarily as a pure Blockchain trading performance analysis tool, but as a premier charting and social networking platform for traders across various asset classes, including cryptocurrencies. While it doesn't automatically import transaction history from exchanges for P&L tracking, its strength lies in its advanced charting capabilities and technical analysis tools. Users can access real-time price data from numerous crypto exchanges, utilize hundreds of technical indicators (like Moving Averages, RSI, MACD), draw trendlines, and set up alerts.
The platform offers powerful charting features, including multiple chart types, timeframes from seconds to months, and customization options. Traders can backtest strategies using Pine Script, TradingView's programming language, although this is more advanced. Its social features allow users to share trading ideas and analyses. While it doesn't track your executed trades' financial performance directly like CoinTracking or CryptoTrader.Tax, TradingView is invaluable for pre-trade analysis and understanding market movements, which are crucial inputs for developing profitable trading strategies.
How TradingView Can Improve Your Trade Decisions
TradingView significantly improves trade decisions by providing the tools necessary for thorough market analysis before entering a trade. Instead of making impulsive decisions based on price movements, traders can use TradingView to:
- Identify trends and patterns on charts using technical indicators.
- Determine potential entry and exit points based on support and resistance levels.
- Analyze price action across multiple timeframes to understand the broader market context.
- Backtest hypothetical strategies on historical data (though actual performance depends on execution).
For a beginner, learning to use TradingView's charting tools is a vital step in developing a structured trading approach. By analyzing charts, you can make more informed decisions about when to buy or sell, and where to place stop-loss and take-profit orders. While it doesn't track the financial outcome of your trades directly, using TradingView for technical analysis is a complementary practice to using Blockchain trading performance analysis tools that track your actual results, creating a feedback loop between strategy planning and performance review.
Step-by-Step Guide to Using Blockchain Trading Performance Analysis Tools
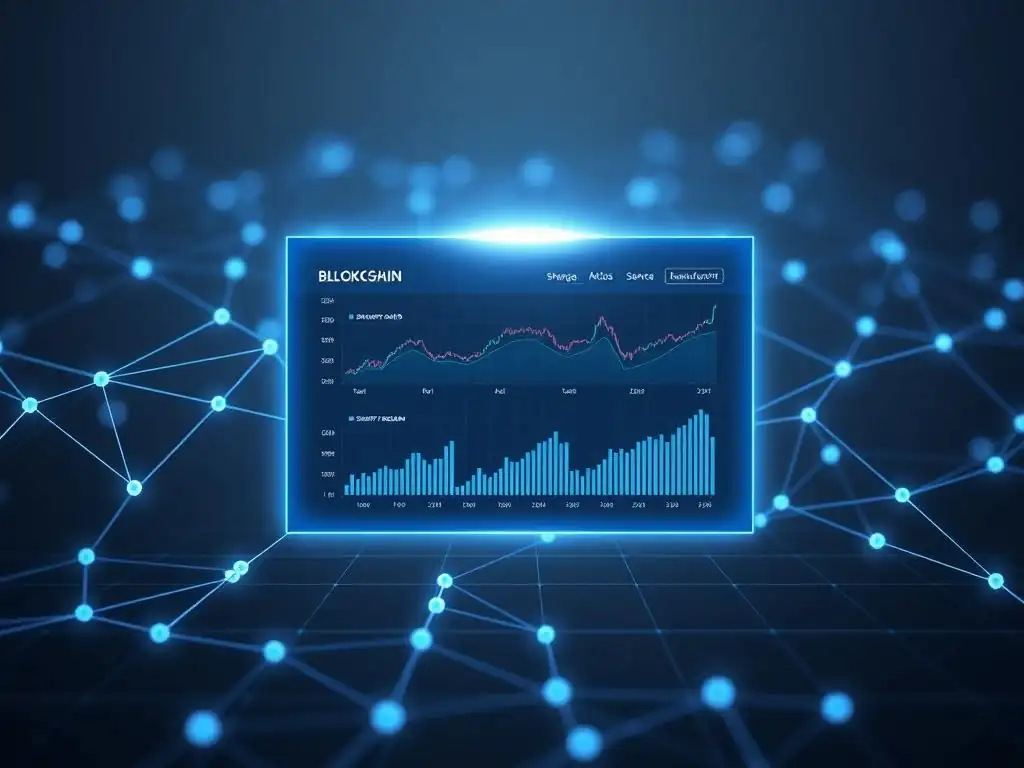
Setting Up Your Trading Account: Initial Steps
The initial step in using Blockchain trading performance analysis tools is setting up your account on the chosen platform. This typically involves creating a username and password. Most tools offer different subscription tiers; choose one that matches the volume of your trading activity and the number of exchanges/wallets you use. Many offer a free tier or trial, suitable for beginners with limited transaction history.
Once your account is created, familiarize yourself with the platform's interface. Navigate through the dashboard, reporting sections, and the data import area. Understanding the layout will make the subsequent steps much smoother. This setup phase is crucial as the accuracy of your performance analysis depends entirely on getting your account configured correctly and preparing for data import.
Importing Transaction Data for Accurate Analysis
Importing your transaction data is the most critical step for accurate performance analysis. Blockchain trading performance analysis tools rely on having a complete record of every buy, sell, deposit, withdrawal, and transfer across all your trading platforms and wallets. Most tools offer several methods for this:
- API Connection: The most recommended method. You generate API keys on your exchanges and enter them into the analysis tool. The tool then automatically pulls your transaction history periodically. This is generally the most reliable and easiest method for ongoing tracking.
- CSV File Upload: Most exchanges allow you to export your transaction history as a CSV file. You can then upload this file directly into the analysis tool. This method is useful for exchanges that don't offer API support or for one-time data imports.
- Manual Entry: For individual transactions or platforms not supported by API/CSV, you can manually enter trade details. This is time-consuming and prone to errors but necessary for capturing all activity.
Ensure you import data from every source you use – centralized exchanges, decentralized exchanges (via wallet address), wallets (for transfers, staking, airdrops), and any other platform where you conduct crypto transactions. Incomplete data will lead to inaccurate performance reports.
Analyzing Performance Reports and Metrics
Once your data is imported and processed by the crypto trading analysis tools, the real work begins: analyzing the reports. Start with the high-level summaries, such as overall P&L for a chosen period (e.g., the last month or quarter). Look at the breakdown by asset to see which cryptocurrencies have been most profitable.
Next, dive into more detailed metrics. Review your win rate – is it consistent? Analyze your risk-to-reward ratio – are you risking too much for potential gains? Look at the breakdown of fees paid – are they significantly impacting your bottom line? Most tools provide charts and graphs that visualize your performance over time, making trends easier to spot. Don't just look at the numbers; try to understand why the numbers are the way they are.
Identifying Trends and Patterns in Your Trading Activity
Analyzing performance reports helps identify crucial trends and patterns in your trading. For example:
- Asset Performance: You might notice that trades on Bitcoin consistently yield profits, while trades on a specific altcoin consistently result in losses.
- Strategy Effectiveness: Analyzing trades executed using a particular strategy (e.g., breakout trading) might show a higher win rate or RRR than trades based on news events.
- Timing: Reports might reveal that trades executed during specific market conditions (e.g., bull markets vs. bear markets, or during certain hours) are more successful.
- Behavioral Patterns: You might see a pattern of selling winners too early or holding onto losers for too long, reflected in your RRR or average trade duration.
Identifying these patterns requires careful review of the data provided by Blockchain trading performance analysis tools. It's not just about seeing the numbers but interpreting what they mean about your trading habits and strategies.
Making Data-Driven Decisions for Future Trades
The ultimate goal of using Blockchain trading performance analysis tools is to make better trading decisions in the future. Based on the analysis, you can identify areas for improvement and adjust your strategy.
If the analysis shows that a specific asset is consistently unprofitable for you, consider reducing your exposure to it or changing your approach. If a particular strategy yields a high win rate and favorable RRR, consider allocating more capital to trades based on that strategy. If fees are eating into your profits, explore trading on exchanges with lower fee structures or trading larger volumes to qualify for fee discounts.
Use the insights gained from your performance data to set realistic goals and refine your trading plan. This iterative process of trading, analyzing performance, and adjusting is key to becoming a more successful and consistent trader.
Common Mistakes in Crypto Trading Performance Analysis
Ignoring Emotional Factors in Trading Decisions
One of the most common mistakes in crypto trading, which directly impacts performance analysis, is allowing emotions to dictate decisions. Fear (of missing out or losing money) and greed (desire for quick, large profits) can lead to impulsive trades that deviate from a planned strategy. While Blockchain trading performance analysis tools provide objective data on trade outcomes, they don't capture the emotional state during the trade. However, analyzing the results of emotionally driven trades within the tool can highlight their negative impact.
For example, a trader might panic-sell an asset during a temporary dip, realizing a loss. When reviewing their performance data later, they see this loss alongside potentially profitable trades. Recognizing that this specific loss occurred during a period of high market fear can help correlate emotional decisions with poor outcomes. Using performance analysis to identify trades made outside of a defined strategy, often driven by emotion, is a crucial step in learning to control psychological biases and make more rational, data-backed decisions.
Overlooking Key Metrics and Their Significance
Beginners often focus solely on overall profit/loss, overlooking other crucial metrics provided by Blockchain trading performance analysis tools. While P&L is the bottom line, metrics like win rate, risk-to-reward ratio, average trade duration, and fees paid offer deeper insights into how that P&L was achieved. A positive P&L might mask underlying issues, such as a low win rate compensated by a few lucky large wins, or a high win rate with an unfavorable RRR where small wins are wiped out by large losses.
Ignoring the significance of these metrics prevents traders from understanding the sustainability and efficiency of their strategy. For instance, consistently high trading fees, visible in tool reports, can erode significant portions of potential profit over time. Failing to analyze metrics beyond simple P&L means missing opportunities to optimize the trading approach, refine entry/exit criteria, manage risk more effectively, and ultimately improve long-term performance.
Failing to Adapt Based on Performance Data
Perhaps the most critical mistake after analyzing performance is failing to act on the insights gained. Having access to detailed reports from crypto trading analysis tools is useless if the trader does not use that information to adapt their strategy. If the analysis shows a specific strategy or asset pair is consistently underperforming, continuing to trade it in the same manner is a recipe for continued losses.
Adaptation could involve adjusting position sizing, refining entry and exit signals, changing the types of assets traded, or even re-evaluating the overall trading philosophy. For example, if analysis reveals that swing trades lasting several days are consistently more profitable than day trades, the trader should consider shifting their focus and resources accordingly. Regularly reviewing performance data and being willing to change one's approach based on objective evidence is fundamental to achieving continuous improvement in crypto trading.
Continuous Improvement: Strategies for Enhancing Blockchain Trading Performance
Setting Realistic Goals Based on Analysis
Performance analysis provides the data necessary to set realistic and achievable trading goals. Instead of aiming for arbitrary profit targets (like "make 100% next month"), use your historical data from Blockchain trading performance analysis tools to set goals based on your actual performance capabilities. For example, if your analysis shows an average monthly return of 5% over the last six months with a consistent win rate of 55% and an RRR of 1:1.5, a realistic goal might be to maintain or slightly improve upon these metrics.
Realistic goals help manage expectations and reduce emotional stress. They shift the focus from speculative outcomes to process improvement. Based on your analysis, you might set goals related to improving specific metrics, such as increasing your average RRR to 1:2, reducing the percentage of losing trades, or decreasing the impact of fees. These process-oriented goals, informed by solid data from crypto trading analysis tools, are more controllable and contribute directly to sustainable performance enhancement.
Regularly Reviewing and Adjusting Trading Strategies
Consistent performance improvement requires a commitment to regularly reviewing and adjusting your trading strategies based on analysis outcomes. This isn't a one-time task but an ongoing cycle. Schedule regular check-ins (e.g., weekly or monthly) to review the performance reports generated by your Blockchain trading performance analysis tools. Compare performance against the goals you've set.
If a strategy is meeting or exceeding expectations, understand why and consider how to leverage its strengths further. If a strategy is underperforming, delve into the data to identify the specific issues – is it a low win rate, poor risk management, or high costs? Based on this diagnosis, make specific adjustments to the strategy. This might involve tweaking entry/exit rules, changing position sizing, or even abandoning a strategy that analysis shows is fundamentally flawed for your trading style or market conditions.
Learning from Past Mistakes: A Case Study Approach
Using a case study approach for past mistakes is a powerful method for learning and improvement, facilitated by detailed records from Blockchain trading performance analysis tools. For each significant losing trade or period of underperformance identified in your reports, conduct a mini post-mortem. Analyze the specific details of the trades:
- What was the setup or reason for entering the trade?
- What was the intended strategy?
- What went wrong? (e.g., missed a key indicator, ignored a signal, poor risk management, emotional decision)
- What was the outcome (loss amount, impact on metrics)?
By systematically reviewing losing trades using the historical data provided by the tools, you can identify recurring errors in judgment, analysis, or execution. For instance, analysis might reveal a pattern of entering trades too early based on insufficient confirmation, leading to stop-losses being hit frequently. Recognizing this pattern allows you to focus specifically on improving your entry criteria. This deliberate process of learning from quantified mistakes is vital for refining your trading skills and enhancing overall Blockchain trading performance.
Conclusion: The Path to Better Blockchain Trading Performance
Recap of the Importance of Analysis Tools in Crypto Trading
In the dynamic and often unpredictable world of crypto trading, relying solely on intuition or hype is a recipe for inconsistency and potential losses. Blockchain trading performance analysis tools are indispensable for any trader serious about self-improvement and sustainable profitability. They provide the objective data needed to move beyond guesswork, offering clear insights into what strategies are working, which assets are performing well, and where critical errors are occurring. By automating the complex process of data aggregation and calculation, these tools free up traders to focus on the more valuable task of analyzing outcomes and refining their approach.
Utilizing these tools allows traders to track essential metrics like Profit and Loss, Win Rate, and Risk-to-Reward Ratio, providing a comprehensive view of trading effectiveness. Platforms like CryptoTrader.Tax and CoinTracking excel at financial tracking and tax reporting, while TradingView offers advanced charting for pre-trade analysis. Together, or individually, these tools form the backbone of a data-driven trading process, transforming raw transaction history into actionable intelligence.
Encouragement to Embrace Continuous Learning and Adaptation
The journey to becoming a successful crypto trader is one of continuous learning and adaptation. Performance analysis is not a one-time fix but an ongoing process. By regularly using Blockchain trading performance analysis tools to review your results, identify patterns, and learn from both successes and failures, you equip yourself with the knowledge needed to navigate the crypto markets more effectively.
Embrace the insights provided by your data. Be willing to question your assumptions, adjust your strategies based on evidence, and control the emotional biases that can derail even the best-laid plans. The data won't trade for you, but it will show you the path to improvement. Consistent analysis and a commitment to acting on your findings are the keys to unlocking better Blockchain trading performance over the long term. Start using these tools today and take control of your trading future.
Frequently Asked Questions
How can blockchain trading performance analysis tools help me improve my trading?
These tools provide in-depth insights into your trading history, allowing you to identify strengths and weaknesses. By analyzing your past trades, you can refine your strategies and optimize your approach.
What are some key metrics to track when analyzing my blockchain trading performance?
Important metrics include your win rate, profit factor, average profit per trade, and drawdown. Monitoring these metrics helps you understand your overall profitability and risk management effectiveness.
Can I use blockchain trading performance analysis tools even if I'm a beginner?
Absolutely! Many tools are designed with user-friendly interfaces and provide clear explanations of the data. Start with the basics and gradually explore more advanced features as you gain experience.
Are there free blockchain trading performance analysis tools available, or do I need to pay for them?
Both free and paid tools exist. Free tools often offer basic analysis features, while paid options provide more comprehensive data and advanced analytics. Consider your needs and budget when choosing.
How can blockchain trading performance analysis tools help me manage risk in my crypto trading?
These tools can help you identify high-risk trades and patterns that lead to losses. By understanding your risk tolerance and implementing stop-loss orders, you can better protect your capital.
Final Reflection: Mastering the Art of Crypto Trading
The journey of analyzing one's crypto trading performance, as we've explored, isn't just about crunching numbers; it's about cultivating a mindset of continuous improvement and self-awareness. In today's volatile market, where fortunes can be made and lost in the blink of an eye, understanding your strengths and weaknesses is paramount to long-term success. This proactive approach, fueled by readily available blockchain trading performance analysis tools, empowers traders to navigate the complexities with greater confidence and precision.
The ability to objectively assess our trading decisions, identifying patterns and biases, is a skill that extends far beyond the realm of cryptocurrency. It's a valuable asset in any endeavor that requires strategic thinking and calculated risk-taking. As the saying goes, The only true wisdom is in knowing you know nothing.
This humility, coupled with a commitment to data-driven analysis, allows us to learn from our mistakes and adapt to the ever-changing landscape of the crypto market.
Now, armed with the knowledge and tools discussed, I encourage you to embark on your own journey of self-discovery. Don't be afraid to delve deep into your trading history, to confront your errors, and to celebrate your successes. By embracing a culture of continuous learning and improvement, you can unlock your full potential as a crypto trader and navigate the exciting, yet challenging, world of blockchain with greater skill and resilience.
Unlock Your Trading Potential: Start Analyzing Now!
Thank you for exploring our guide to analyzing your crypto trading performance! We hope you've gained valuable insights into how to refine your strategies and boost your profitability. Ready to put that knowledge into action?
Here's how to take the next step:
- Immediately start keeping a detailed trading journal to track your trades carefully. This simple step can significantly enhance your trading discipline and decision-making.
- Share your favorite trading analysis tips on social media — let’s learn from each other and grow as a community!
- Unexpected Action: Try backtesting one of your previous trading strategies on a demo account to see how it would perform under current market conditions.
Which performance metric will you focus on improving first, and why? Let us know in the comments!
Leave a Reply